S G Capital Provides Global Market Insights in all market segments with Coverage on all Global Instruments in specific Weekly Reports.
Wednesday's Commodity Report
- CRB / DBC
- GOLD
- SLV
- GDX
- OIL / USO
- COPPER / JJC
- DBB
- DBA
Detail Coverage
- Daily Trend Adjusted Strategy - 3x3 / 9EMA – DOW, SPX
- Selected Sector may have (1) up to (8) Analytic Charts as Titled below
- SETUP charts Weekly – 3 Year with RSI, CCI, MACD (11 W / 40 W ) SMA
- SETUP charts Daily – 3 Year with RSI, CCI, MACD (11D / 55D) SMA
- POM Analysis - Technical & Pattern Analysis & Price / volume Analysis,
- PEC Analysis, Ratio Analysis ( Only if applicable)
- Sentiments ( If Extreme character)
- Correlation Ratio Analysis with CRB by 365 days Basis
- Trend Reversion Analysis – Long Trend Chart
- Trend Reversion Analysis (Inflation Adjusted) – Long Trend Chart
- Appendix - History of past Signals & Key Criteria
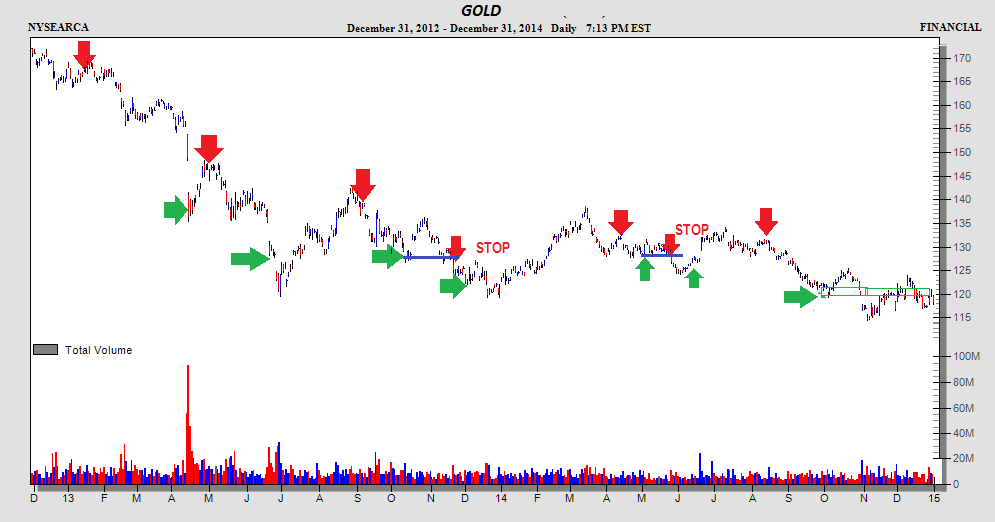
GOLD - Price Oscillation Model - POM Signal
2013-2014
2012

2011
2010-2007
2007-2003
Objective
Focus is on the short term and Intermediate term turning points of the Commodities via Integrated Methodologies of POM’s and PEC’s overlay. It utilizes multiple input signal from PEC derived with ABCD Price projections, where D price point to be validated via Price Oscillation Model ( POM) . POM’s price & Quality volumes (PQV) , patterns conclusions is derived to overlay POM /PEC gives a Confluence Price Zone “ around D Zone” ( within +/- 1.5% variation ). This is ACTIONABLE ZONE, on scaled in entry with stops if required on other side of confluence) with margin for volatility & Risk tolerance. This is supplementary Analytics to add value to RA/ RI Framework for Risk Management.